| 1. Introduction | |
The Ricardian model explains much of world trade since the Roman times until WWII. The world was basically an agricultural economy with a small manufacturing sector, which began to appear at the end of the industrial revolution (1760 - 1840). The word "manufacture" (make something manually) was first used in this period. Before this, goods were hand-made. Grains were exported from Egypt; Gold and silver were mined in most countries that Rome conquered, including Britannia and Iberia (Spain). These precious metals were then exported to China to pay for Rome's imports of ceramics and silk. After the Empire collapsed in the 5th century, Rome stopped mining gold and other precious metals. Florence (in 1252 AD) minted florins, and subsequently, Venice and Genoa began to mint ducats and genovino. The Ricardian model becomes more relevant in the 21st century, as countries compete to develop high-tech industries. R&D expenditures. The Heckscher-Ohlin (HO hereafter) model is a better description of the world economy after WWII. (Some trade is explained by the factor abundance and the rest by comparative advantages.) It is based on the assumption that trading countries adopt the same production technologies. The idea was first conceived by two Swedish economists, Eli Heckscher (1919) and Bertil Ohlin. Rudimentary concepts were further developed and supplemented later by Paul Samuelson and Ronald Jones among others. There are four major components of the HO model:
Due to the difficulty of predicting the patterns of trade in a world of many goods, the Heckscher-Ohlin-Vanek Theorem that predicts the factor content of trade received attention in recent years. |
|
Eli Heckscher (1879 - 1952) |
Heckscher was a Swedish economist. He is probably best known for his book "Mercantilist." Although his major interest was in studying economic history, he also developed the essentials of the factor endowment theory of international trade in a short article in Swedish in 1919. It was translated into English thirty years later. |
Bertil Ohlin (1899-1979) |
He served in Riksdag (Swedish Parliament), was the head of liberal party for almost a 1/4 of a century. He was Minister of Trade during World War II. In 1979 Ohlin was awarded a Nobel prize jointly with James Meade for his work in international trade theory. |
| Why HO model? | It is based on the assumption that countries have identical production technologies. This model more accurately describes the world economy after WWII. The Ricardian model is more relevant to the world economy before WWII. There were significant differences in production technologies between industrial countries and developinig countries. |
| HO Model = 2 × 2 × 2 model (2 countries,
2 commodities, 2 factors)
For example, there are two countries (America and Britain); each country is endowed with 2 homogeneous factors (labor and capital) and produces 2 commodities. This is the smallest case of "even" model, i.e., the number of commodities is equal to that of factors. Extending the model to a more general case is not easy. In fact, the results obtained from a more general model do not have the clear, common sense interpretations which the simple HO model enjoys. |
|

| 2. Factor Price Equalization Theorem | |||||||||||||||||
| Among
the four main results of the HO theory, FPE is the most fragile theorem.
If any of the eight assumptions is violated, it willl not hold. However,
perhaps this is the single most important finding in trade theory; it shows
how trade affects income distribution of the global economy.
Of course, the assumptions are somewhat unrealistic in the sense that they are not likely to be observed in the real world. However, even if some of the assumptions are violated, international trade has a tendency to equalize factor prices; it will remove the wage gaps between countries, despite the constraint that trading countries impose on the movement of factors, in particular, on the movement of workers. |
|||||||||||||||||
| China raises wage to $10/hour in 2015 | According to WSJ (June 1, 2010), "Honda Offers Strikers
in China 24% Pay Boost "
In June 2010, Honda Motors, China has offered Chinese workers in Beijing a 24% wage hike, raising their average monthly salary from 1500 yuan to 1860 yuan (about $10 per hour), raising their monthly salary from about $250 to about $300 per month. BMW pays $67 per hour in Leipzig and is profitable. US autoworkers used to earn $150,000 (including benefits) a year, which amounts to about $75 per hour. GM pays now (2015) $58 an hour (Ford = $55, Toyota = $50). Mexican autoworkers get $8 per hour. Hourly wage of Chinese autoworkers is about $5.20, which amounts to Y230,000 or $35,000 per year for the average workers.
|
||||||||||||||||
| Autarky | 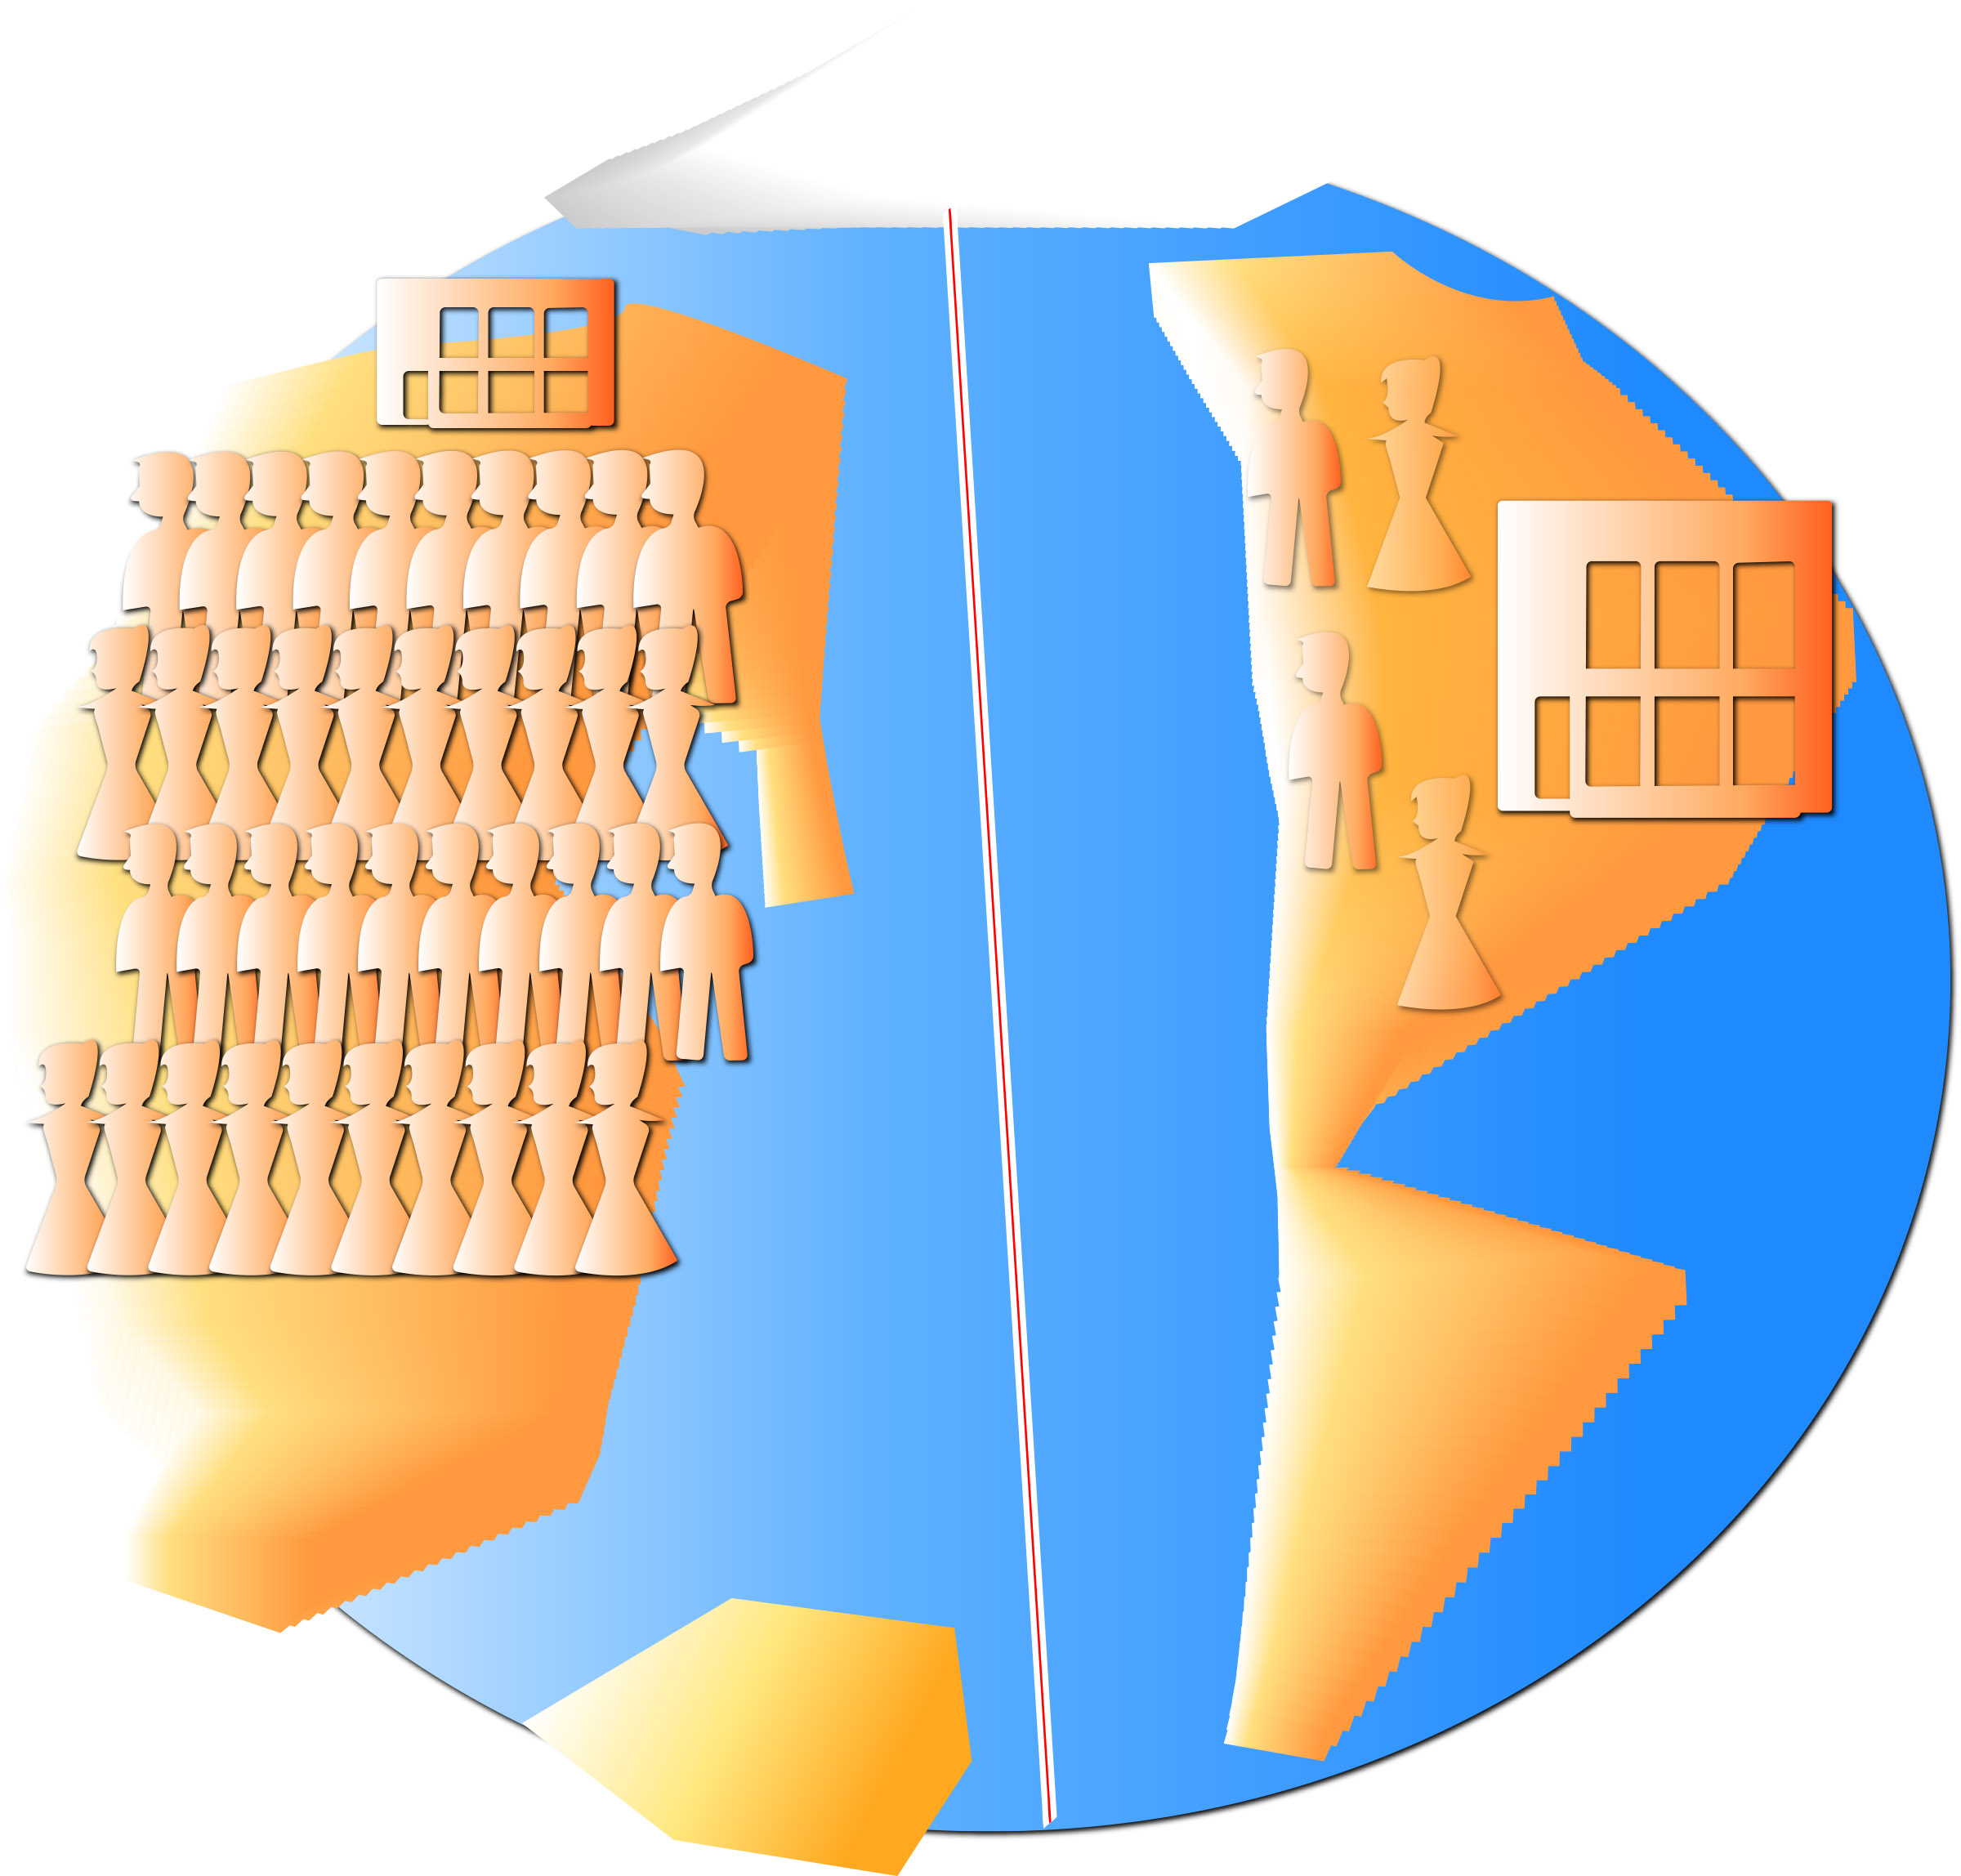 |
||||||||||||||||
In autarky, factor prices differ between countries, depending on regional market conditions. |
|||||||||||||||||
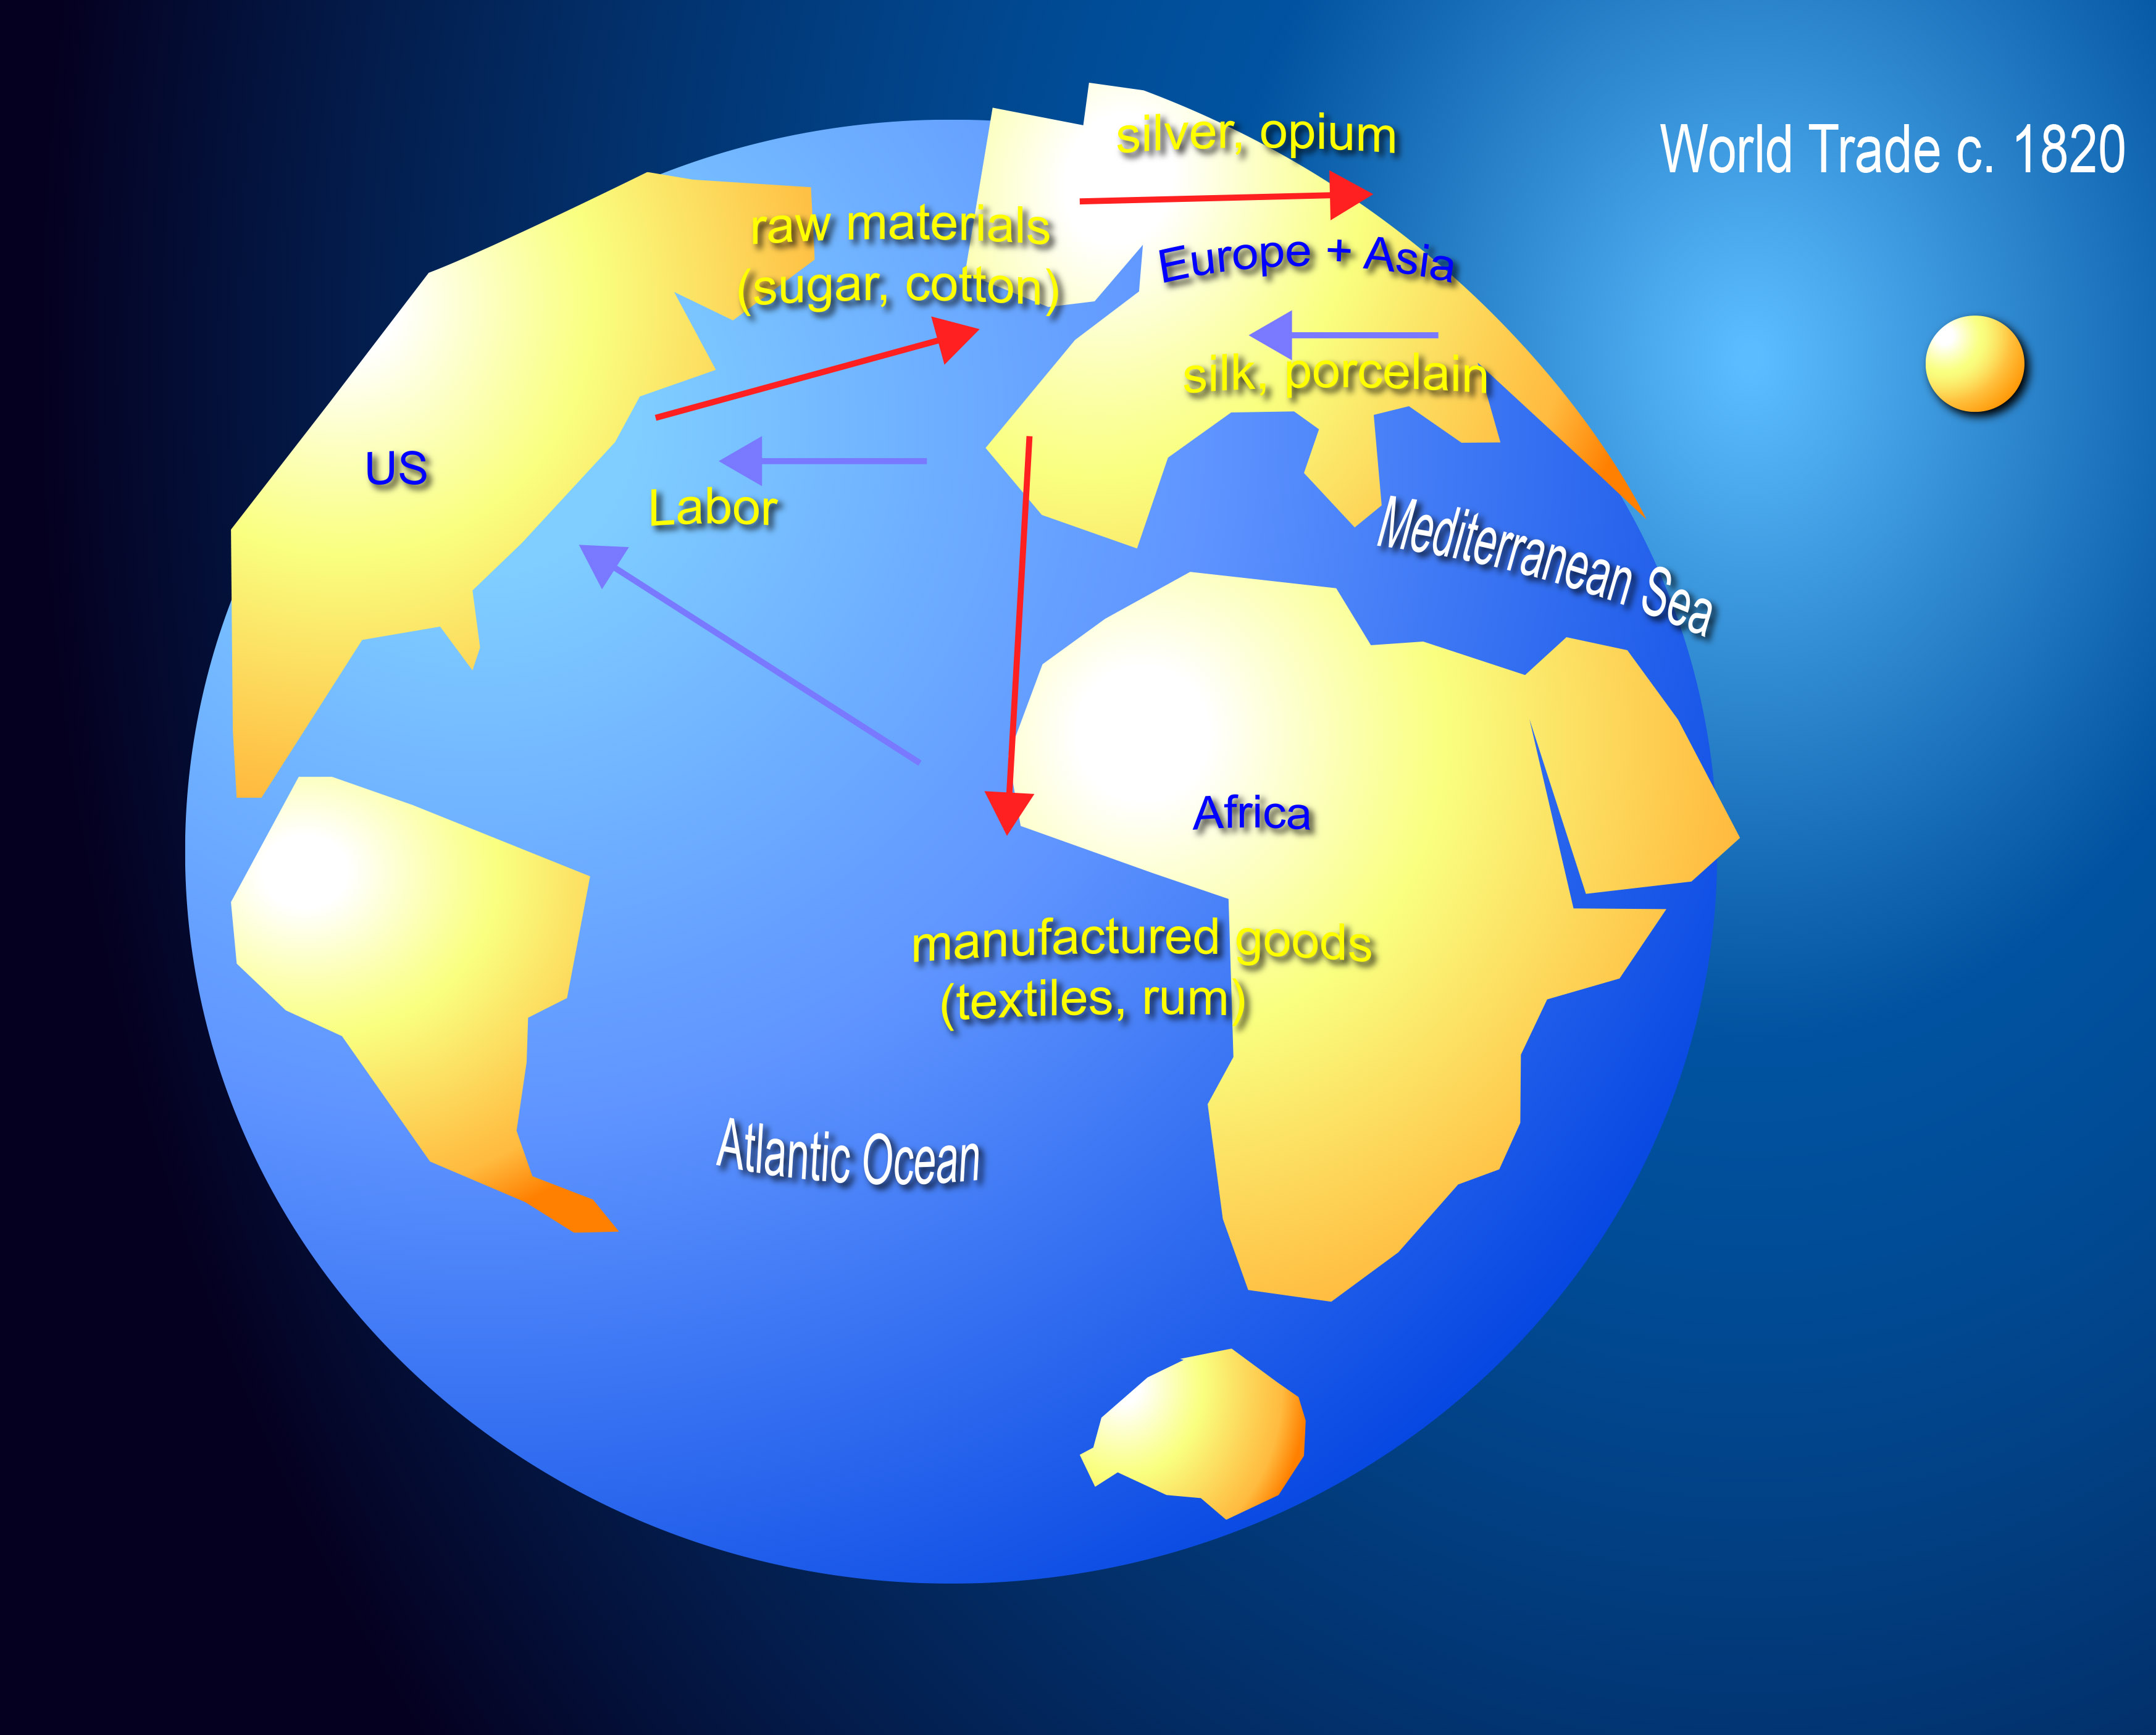
| Triangular world trade around 1800 AD |
World trade around 1800 AD was more complex than Heckscher-Ohlin trade, because the US imported workers from England and Africa, but on the whole the US was exporting the land-intensive goods such as cotton and rum. |
||||||||||||||||
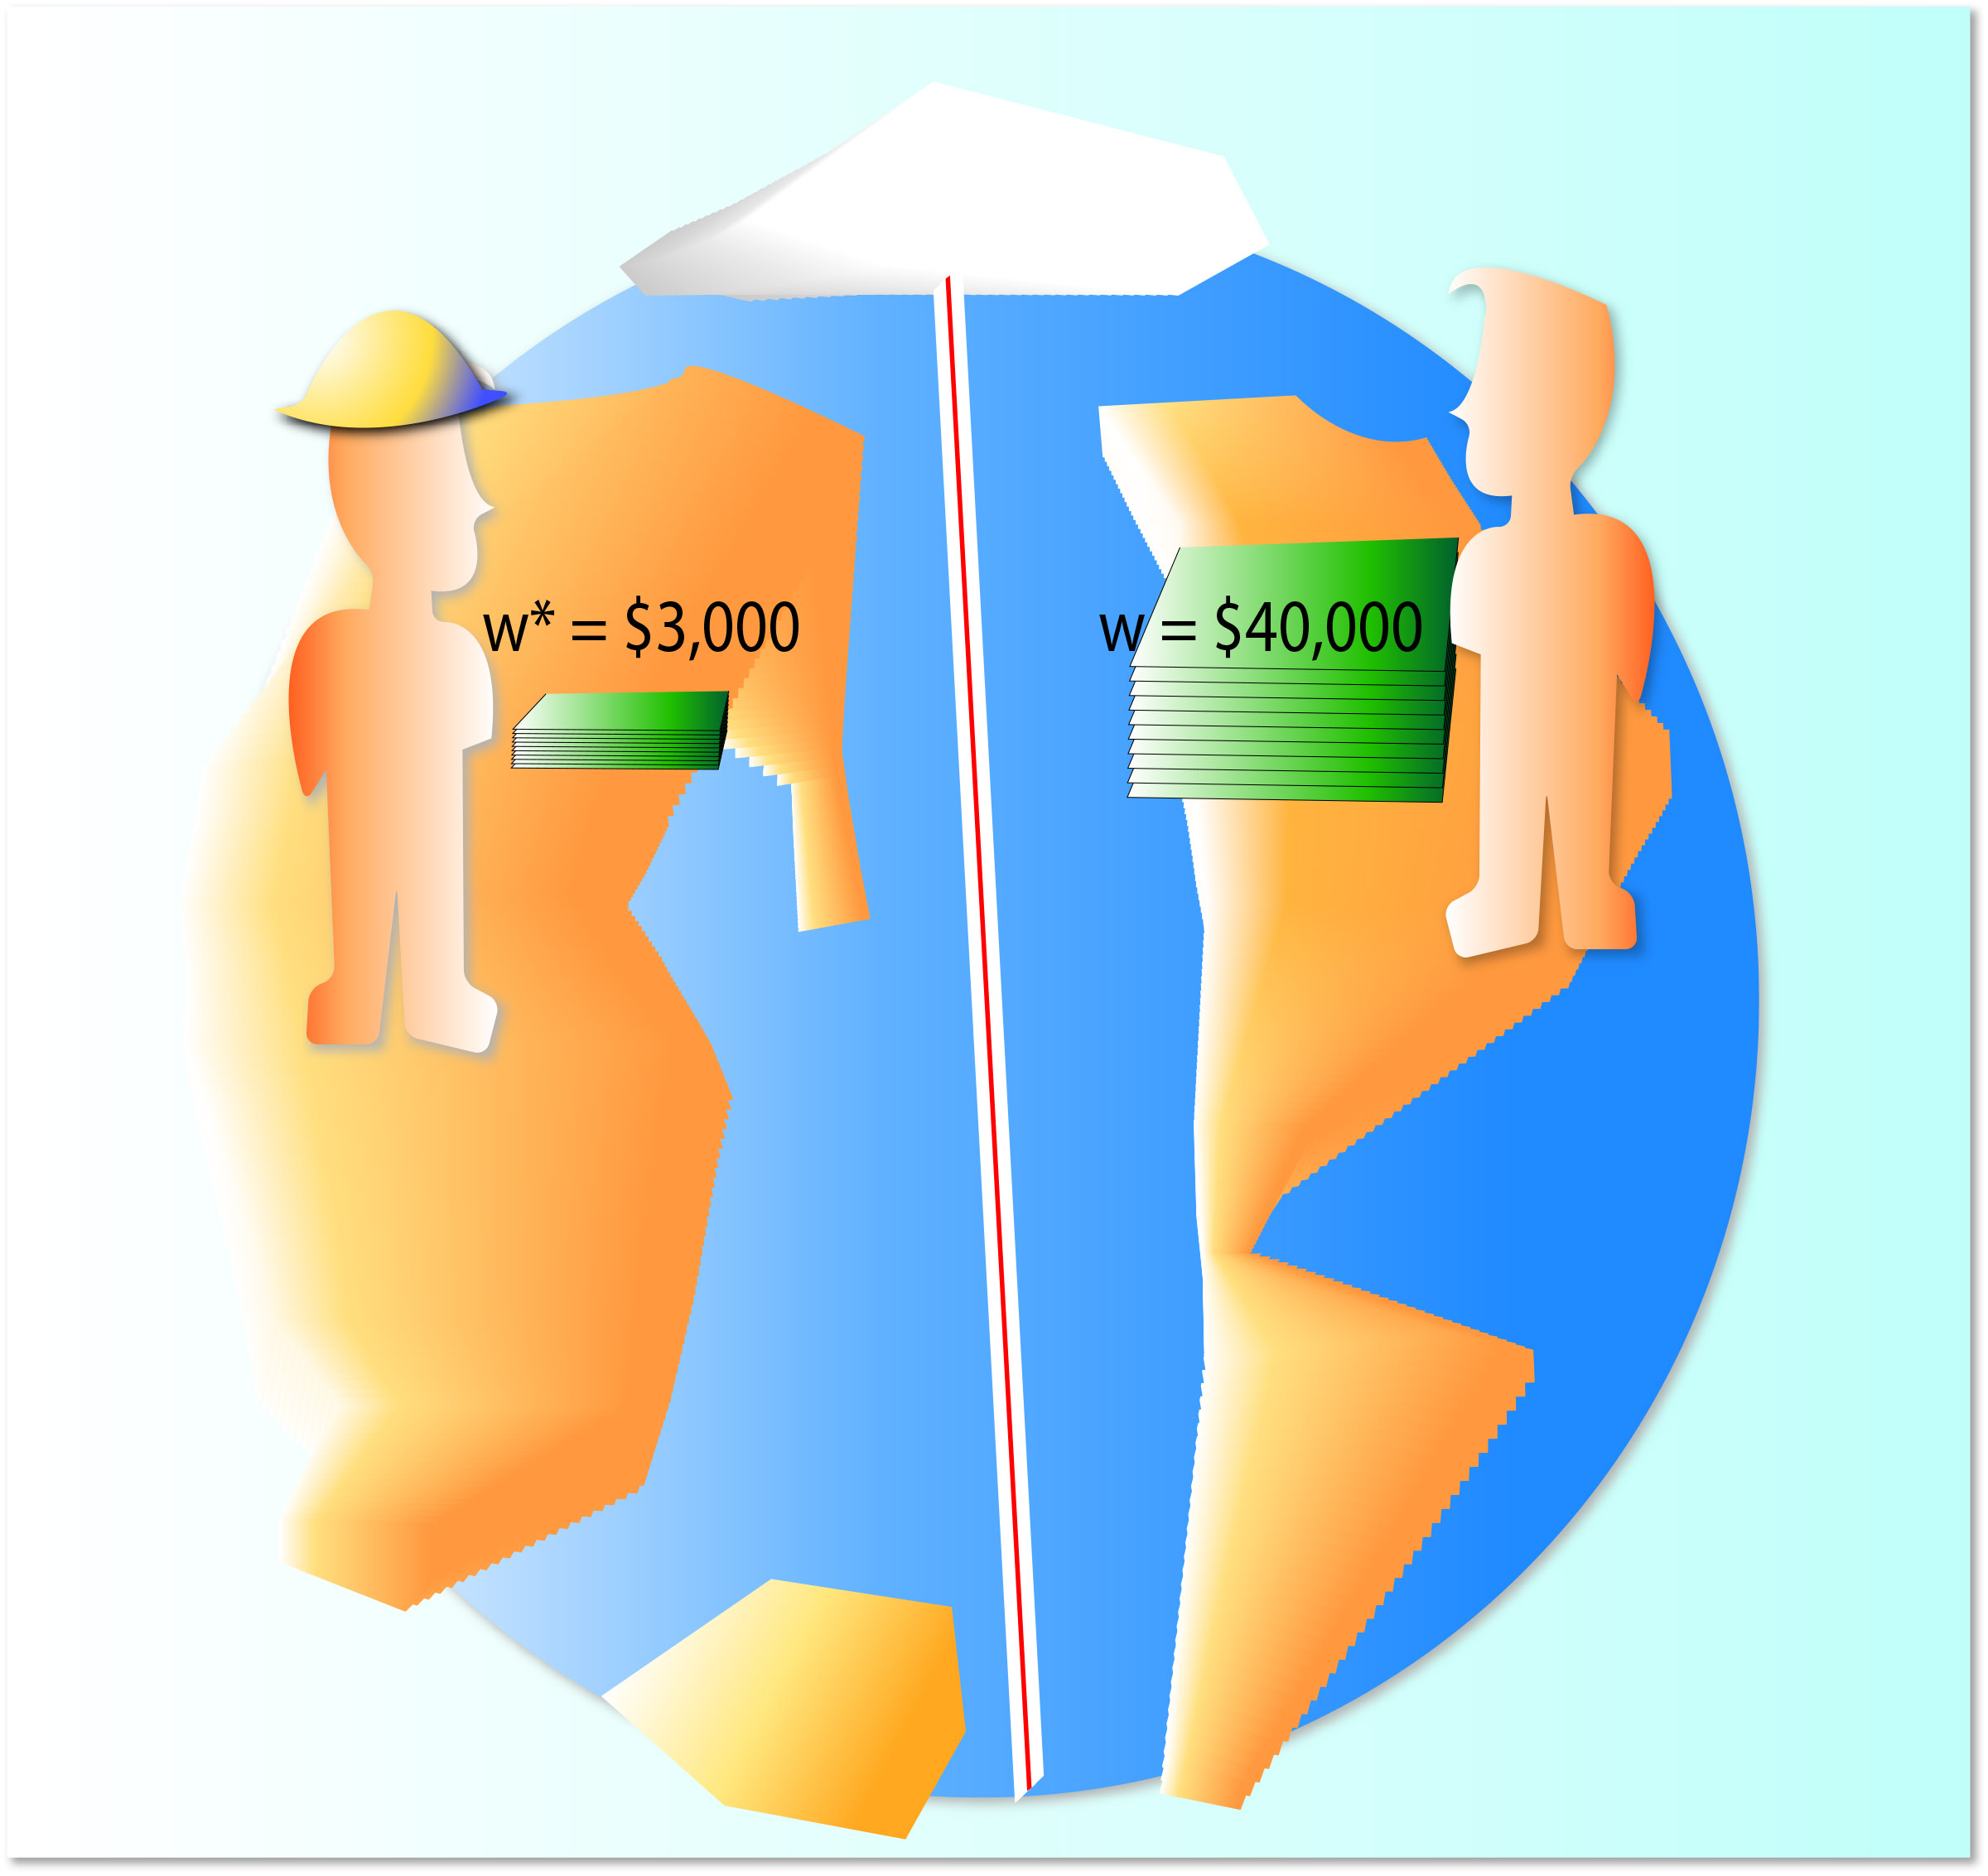
| After free trade | What will be the impact of free trade on factor prices such as wage and interest rates? FTA expedites the process of FPE (because of capital movement to Mexico.) Rexnord's Indianapolis employees earn $25 an hour plus benefits, compared to $3 with no benefits in Mexico. Rexnord is moving to Mexico . Bearings and gears produced in Mexico enter the US freely. |
| 3. Assumptions of FPE | |
| 1. No artificial barriers to trade | World trade is assumed to be free from restrictions, such as tariffs, quotas, and voluntary export restraints. In reality, very few countries practice free trade. Most countries protect some industries due to the presence of lobbying. |
| 2. No transportation cost | Transportation costs are assumed to be zero (No natural barriers). In reality, transportation costs are a significant portion of the marketing costs of most traded goods, especially in agricultural products. Transportation costs declined significantly due to the development of navigational technology and canals. Remark: This is unrealistic. However, it is not a bad assumption, because transportation costs inhibit and reduce trade volume; it does not reverse the trade pattern between the countries. The purpose is not to ignore reality but to isolate the pure effects of trade.
Expansion of Suez canal. |
| 3. Perfect Competition (PC) + Full Employment (FE) | PC prevails in both product and factor markets. This assumption rules out monopolistic and oligopolistic market structures. It also rules out price and wage rigidities. In a perfectly competitive market all buyers and sellers are price takers, i.e., each one is too small to exert market power and influence market prices. All factors are fully employed.
|
| 4. Factors are mobile in each country but are immobile across national borders. | Like Ricardo, HO model draws a sharp distinction between domestic and external factor mobility. The maximum degree of factor mobility is permitted between industries within the same country domestic factor mobility). But neither capital nor labor can cross national borders international factor immobility ). No discrimination among workers. Discrimination ⇒ the firm pays a higher wage to one group and a lower wage to another. Such practice is not profitable (Why not pay the same low wage to everybody?) DFM insures that workers move from a low wage region to a high wage region, and capital moves from a low interest country to a high interest region. The net effect is that all factor prices are the same within a country. IFI implies that Mexican workers are not allowed to migrate to, the US. |
| 5. No specialization | Neither country specializes in one commodity. ⇒ Each country produces both goods.
|
| 6. Production functions exhibit constant returns to scale (CRS) and are differerent between industries | Such a production function
is sometimes said to be homogeneous of degree 1 - HD(1) for short here.
CRS means that a proportionate increase in all inputs increases the output by the same percentage. Specifically, CRS means: If y = F(L,K), then y' = F(2L,2K) = 2y.
Along any expansion path (e.g., expansion path 1), output increases at a constant rate as the amounts of inputs increase. Moreover, MPL and MPK are constant along the expansion paths. |
| 7. Both countries have Identical technologies | Paper was invented by Cai Lun in AD 105. Printing with carved wood blocks appeared during the Tang dynasty. Movable type had been invented during Song dynasty (c. 1050 AD), but the Gutenberg printing press (1436) made printing popular. After the Battle of Talas (751, Abbasid-Tang war), Muslims extracted the secret of papermaking (Chinese prisoners were released if they could teach ten Muslims any valuable knowledge.) Paper technology did not reach Spain until 1150. Production functions are the same in America and Britain. The HO model is a long run model. Ohlin argued that "the physical conditions of production are everywhere the same." Some countries may be slow to adopt new technology. With the development of modern telecommunications, information travels fast. This is due to declining transportation and communication costs. |
| 8. No factor intensity reversal | to be explained later. |
An important question is: Without trade barriers, natural or man-made, free trade will equalize output prices. Will free trade also equalize factor prices? |
|


| 4. Cultural Impacts of FTA | |
Role Model for other countries
|
An FTA creates a large free trade area with common factor prices. It increases the economic power of the area and promotes its culture. (e.g., US, China.) FPE also increases factor mobility. One denarius was a good wage for one day's labor anywhere in the Empire. Especially, low wage countries tend to adopt the culture of the high wage economy. (i) In 331 BC, Alexander seized the treasury of Persepolis, and minted drachma coins from the silver looted there (120,000 talents of gold and silver from Persepolis, 50,000 talents from Susa, 26,000 talents from Ectabana. In total Alexander's loot was over 200,000 talents. Today the haul would be worth about $20 billion. (1 talent = 960 troy oz ≅ $4.8 billion at $25/troy oz, and if 10% were gold, then 20,000 talents of gold ≅ $23 billion.) These coins were a great stimulus to the European economy. One side of these coins showed Alexander as Heracles. Later, Julius Caesar also minted silver denarii with his portrait on the obverse. The Roman style of government was copied in Western Europe and the Greek became the lingua franca, similar to Butonghua in China.
An Italian inscription which explains that the body of an ancient ruler, Caesar, was deposited here. Julius Caesar laid the cornerstone of the Roman Empire (27 BC - 476 AD). By conquering the neighboring countries, Roman legions also performed police function and ensured safety of travelers throughout the Empire. For example, the Praetorian Guard and Roman legions stationed in various outposts provided peace and maintained law and order throughout the Empire. As a result, international trade flourished on an unprecedented scale. Licinius Crassus crushed the Spartacus rebellion (71 BC). Silver denarius was worth about $50 - 100 (to buy bread as of 2015) during the times of Jesus. pay = 225 denarii (about $5-10,000) in the first century. (ii) In the West, Caesar and Augustus laid the foundation for a large free trade area (27 BC - 476 AD). Augustus built roads to military posts. The Roman roads comprised more than 250,000 miles, of which 50,000 miles were stone-paved. Horses were used to carry mail. (50 miles a day) Western Europe borrowed the Roman system of government with senate consent . (iii) Standardization: one government, one language (Greek), and Roman standardization . All roads lead to Rome! Romans built roads to Lutetia (Paris today) and aquiducts during the first century AD, and founded Londinium (London today) around 43 AD. The Roman empire also became a common market (mobile factors). People in the Mediterranean world spoke one language (Greek), had one government (Roman) and traded freely throuout the Empire. It provided the foundation of the Western civilization. (Caesar →Kaiser in Germany → tsar in Russian). (iv) In China, Qin Shihuang united the 7 warring states (which ended the warring states period, 476 -221 BC), and created a large free trade area in 221 BC, standardized Chinese characters. (v) Income Effects on Morality: A permanent increase in income increases the moral standards. (Income growth raises moral sensitivity. Gradually, gender discrimination, slavery, etc. disappears) Black death and the subsequent rise in wage: Florentine women began to receive inheritance. Since the US created a large free trade area by eliminating interstate trade tax, it became the hegemon or dominant power in the 20th century. European countries are imitating the US by creating the EU. Now most invoices are written in English even between countries not involving trade with the US. |
|
Augustus |
During the period of the Empire, portorium (tariff) was quadragesima (1/40 = 2.5%) of the value of imported goods. Gradually, the silver content of denarius was reduced to cover the budget deficit. The Roman army grew from 250,000 troops to over 600,000. w = 225 denarii (legionaire, about $10,000 today), The countries that received Roman influences generally have a higher living standard than the rest. |
| Since the 1960s, the massive tide of globalization is changing the lives and economies of large trading blocs. | |
| In Roman Britain, a French girl Fortunata cost 600 denarii (AD 80), silver fir tablet, Museum of London (The Telegraph). Papyrus was not easily available, and the Romans wrote on wood tablets, using a metal stylus to scratch words in black wax. | |


| 5. Unit Value Isoquants | |
| Definition | A unit value isoquant is a locus of input combinations
that yield $1 worth of output.
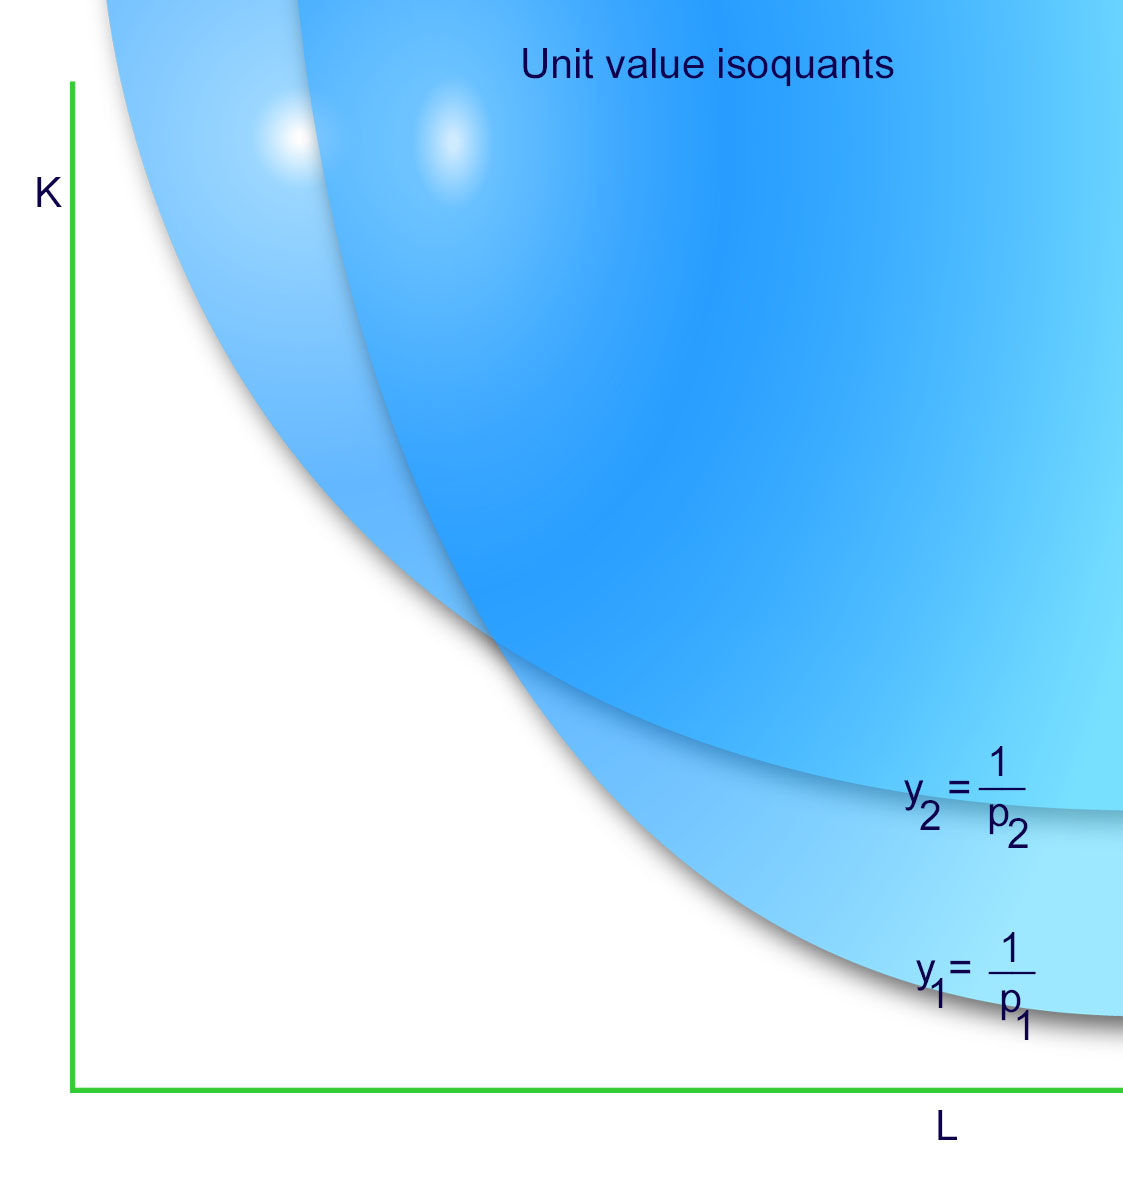
(1) Among many isoquants choose the one for which p*2y2 = 1, or y2 = 1/p*2. Figure 1, Unit value isoquant
|
| Different production functions | (2) Different production functions yield different isoquants:
Two different UVIs intersect each other. Figure 2 In Figure 2, industry 2 is more capital intensive than industry 1. |
| Efficient productoin | If factors are not chosen optimally, production costs will
be higher unnecessarily.
(3) Choose y2, L2, and K2 to maximize Π = p*2y2 - wL2 - rK2 subject to y2 = F2(L2,K2). Once the desired output is chosen, the cost must be minimized. The equilibrium condition is: MRTS = w/r Figure 3, Implication of cost minimization
|
|
Specialization: Survival of 1 industry only. |
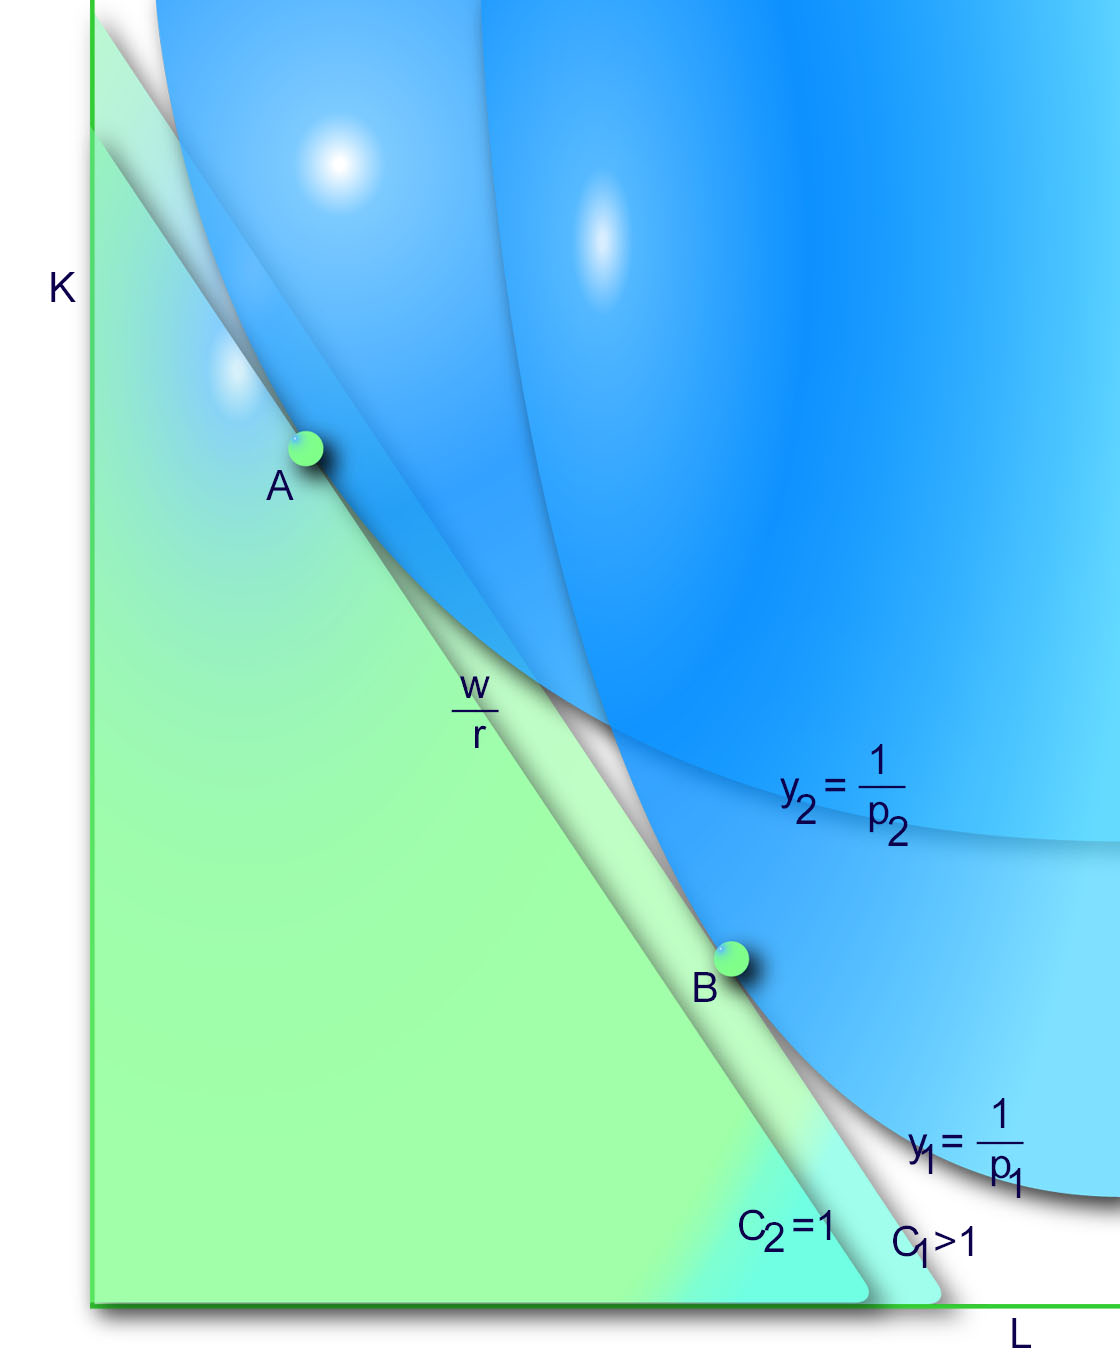
(4) "No specialization" implies that a common isocost curve
must be tangent to both unit value isoquants. Suppose not.
Figure 4 An arbitrary pair of factor prices (w,r) cannot prevail, because it causes the economy to specialize in one good. For instance, given the factor prices represented by the slopes of the two isocost curves, industry 2 survives at point A (p2y2 = c2) The tangency points (both A and B) yield exactly $1 revenue. But the production costs at points 1 and 2 will differ. For example, C1 > C2 = 1. Thus, firms will produce only commodity 2, which costs less but yields the same revenue. That is, the country specializes in good 2 in the above example. |
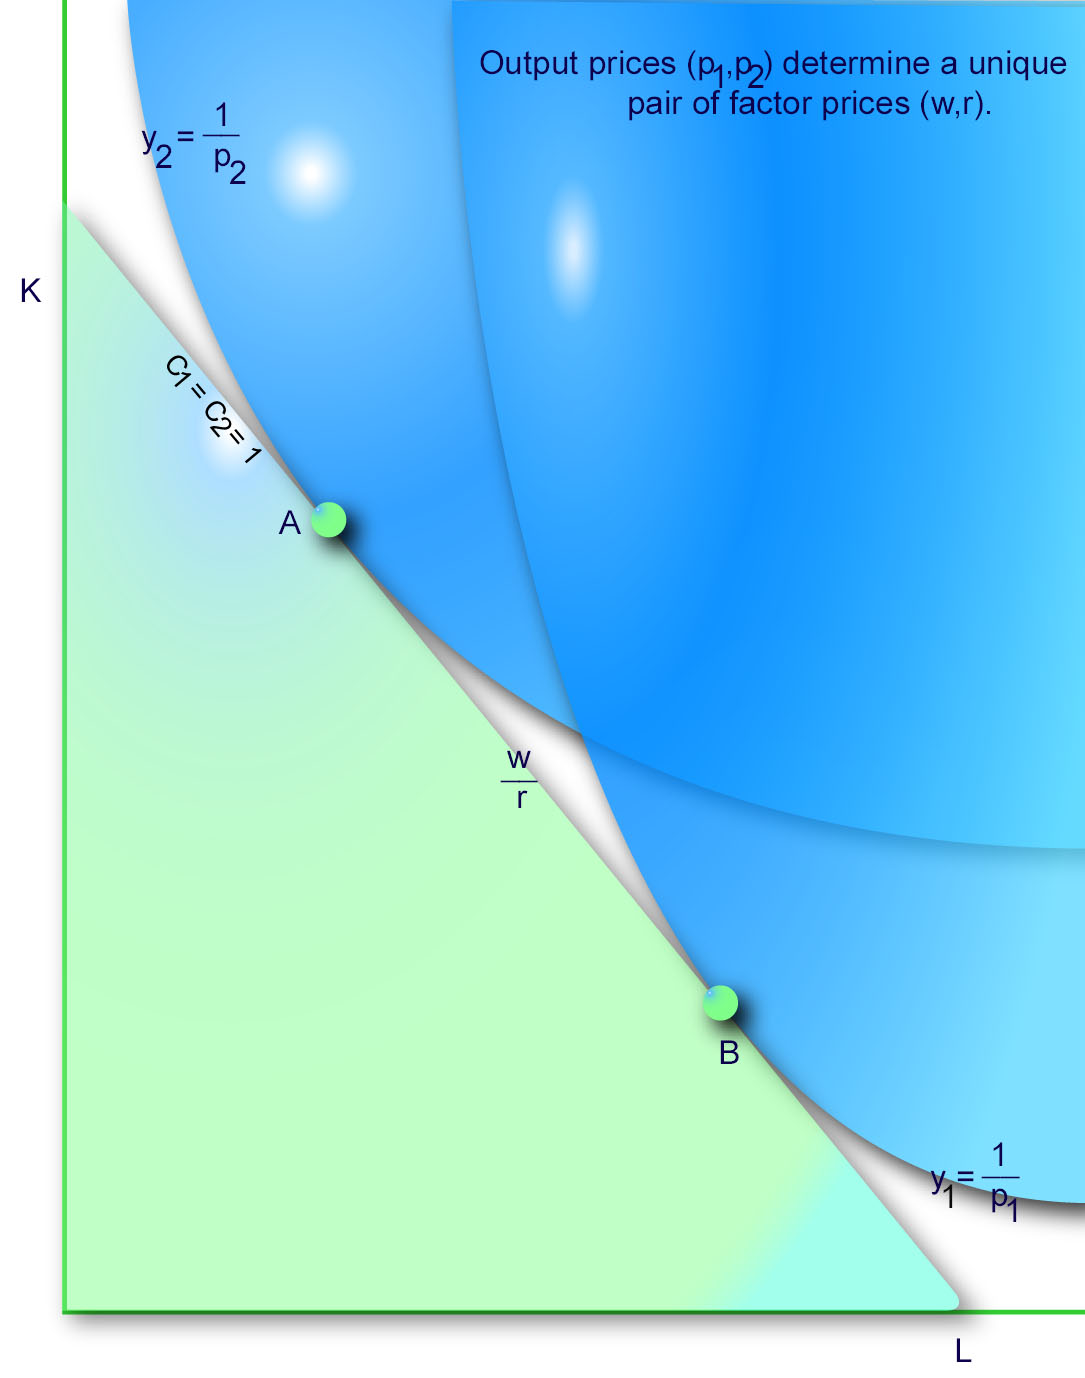
| No specialization (both industries survive) | Thus, for a given pair of output
prices (p1,p2), there exists a unique pair of factor
prices (w,r). This implies that a pair of output prices completely determines
a pair of factor prices. Within a country, (p*1,p*2)
⇔ (w,r).
Figure 5, Common Isocost Curve |


| 6. Factor Price Equalization Theorem | |
| FPE | Given assumptions 1 - 8, factor prices
will be equalized between countries. That is, w = w*, r = r*. |
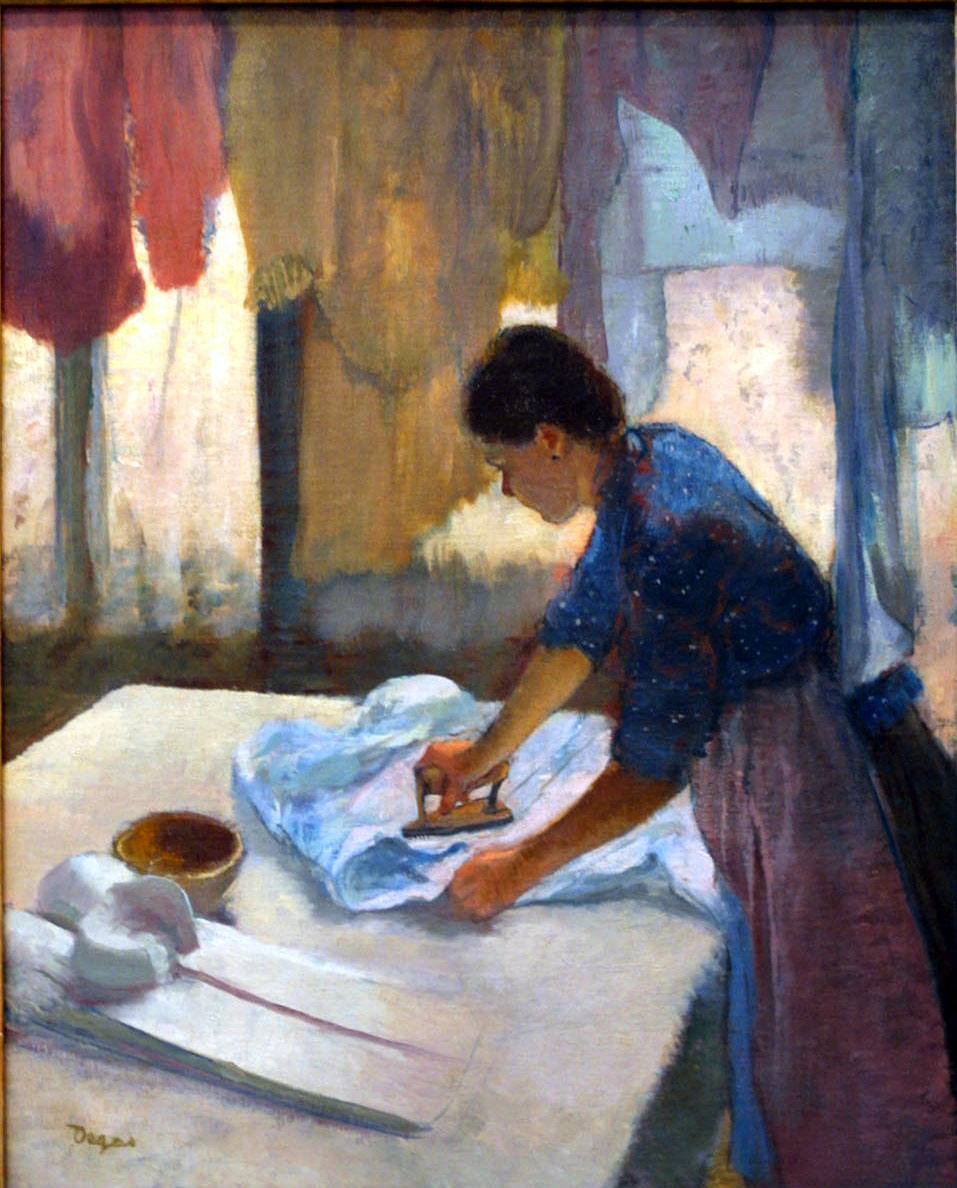 |
An ironing woman, Edgar Degas, National Gallery, Washington, DC How will her wage be affected by free trade? Wages of blue collar workers will be affected. However, wages of skilled labor or professionals (MDs and lawyers) are protected because medical and legal services are not traded. |
| Illustration |
|
| Proof | PC in factor markets + No specialization imply
w = p1MPL1 = p2MPL2 r = p1MPK1 = p2MPK2 |
The same is true in the foreign country. w* = p*1MP*L1 = p*2MP*L2 r* = p*1MP*K1 = p*2MP*K2 |
|
No Barriers to Trade + No Transportation Costs imply p*1 = p1 and p*2 = p2. (Free trade implies output price equalization) Thus, w* = p*1MP*L1 = p1MP*L1. But will marginal products of labor in any industry be the same in the two countries, when they depend on K and L used? (yes, if they are on the same expansion path!) |
|
Identical Technologies IT: both countries have the same isoquant maps. This and (3) imply that HC and FC have the same set of unit value isoquants. No FIR implies that expansion paths are unique in each country, and the two countries have the same expansion paths, as shown in Figure 6. (k1 = k*1, k2 = k*2). Marginal product of each input depends on the amounts
of K and L. However, for CRS industries, MPL
and MPK are constant along the expansion path of each industry.
The following diagram illustrates MPL maintains constant height
along the expansion curve Ok2. Figure 6. Effects of CRS on marginal products. Recall that along any expansion path, output increases at a constant rate. Hence, marginal products (MPL and MPK) are constant along any expansion path. |
|
| HD(1) or CRS: Expansion paths
are rays from the origin, along which MPs remain constant. Each country
chooses an input allocation along each expansion path, depending on its
resource endowment. However, regardless of their locations, A = (L1,K1)
and B = (L*1,K*1), marginal product of each input
does not depend on the output level; it depends only on the capital-labor
ratios. In Figure 5a, CRS implies that marginal products remain constant
along each expansion path, regardless of the output levels. Thus,
MP*Li = MPLi, MP*Ki
= MPKi
w* = p*iMP*Li = piMPLi = w, (wage equalization) r* = p*i MP*Ki = piMPKi = r. (interest rate equalization)
|
|
The Great Famine in Ireland in 1845. About half a million were evicted and 1 million died.
Potato Famine in Ireland. (rents and tithes accounted for 40% of gross output in the 19th century England.) The majority of the population then had little or no land. 40% of Irish houses in 1841 were one room mud cabins with natural earth floors, no windows and no chimneys. Until 1900, 97% of the land in Ireland was owned by landlords who rented it out to tenant farmers. (Marjorie Bloy, A Web of English History) Wage was a few pence a day, and rents were £2 per year for a cabin and potato garden for the cottiers. Under the conacre system, the rent was generally £6 to £8 for a single crop of potatoes or corn. The landless laborers with no leases worked irregularly. James Reilly) |
|
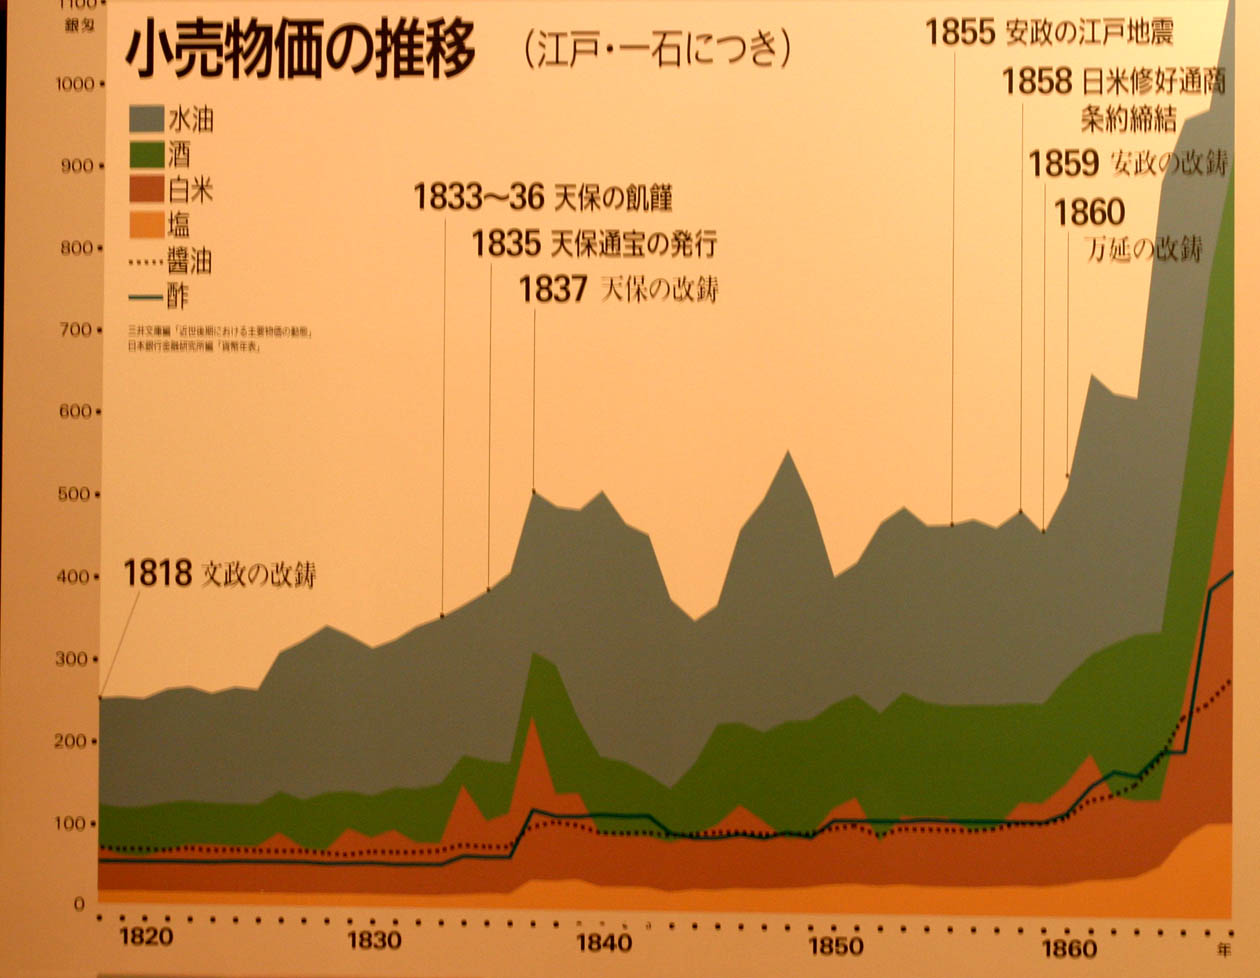
| Japan | Tax on harvests (rent) was about 40 - 50% during the Edo period (1603-1868). R. P. Dore (Far Eastern Survey, 1958) noted that "in pre-war Japan nearly half of the cultivated area was farmed by tenants. Only a third of the nation's farmers owned all the land they farmed. About a quarter rented nearly all their land. ... average rents represented nearly half of the gross value of annual yield . Land rent was a fraction of harvest, which was about 50% of harvest in 1930 (Toshihiko Kawagoe, 1999). Rents were often over half the annual farm revenue during Meiji period. Pressured by General MacArthur, the Japanese government in 1946 instituted a land reform, which helped tenant farmers to purchase the land they cultivate at low prices. What will be the impact of trade on land rent? |


| 7. If FPE is not observed in the real world | |
| FPE in auto industry |
Workers are not interested in a wage hike (which will benefit workers that remain hired) but long run survival of the industry and LR employment. |
| If not FPE, then what? | 1. It could mean that the Heckscher-Ohlin model does not apply to all trade patterns. It applies to industries in which factor proportions are important, e.g., agriculture and manufacture. |
| 2. Tariffs and transportation costs may be high. Watermelon price is high in Japan ⇒ a high tariff in Japan. square watermelon (from Japan) is $800 in Moscow ⇒ a high tariff in Russia. In practice, transportation costs are not negligible. Free trade does not equalize output prices or wipe out factor price differentials completely, but will reduce the gap in factor prices between countries. |
|
3. Capital is more mobile than labor. If FPE does not hold, both factors have incentives to move across national boundaries. If stringent restrictions are imposed on migration, it is the capital that will move in search of lower labor costs. This means outsourcing and a huge job loss in high wage countries, unless there is a restriction on capital mobility. Capital mobility further reinforces the effect of free trade to equalize factor prices. |
|

8. A Glimpse into the Future of the World Economy |
|
| Will income per person be equalized? (Yes and no) | Yes, in the absence of technological innovations, LDCs learn production technologies. In the long run, the division between LDCs and developed economies may become blurred. No, advanced economies invest in R&D. They are ahead of LDCs. Continued investment in the domestic market results in diminishing returns (MPK declines). Foreign direct investment (FDI) is more profitable, but FDI results in technology transfer to LDCs (and w* rises). |
National income is written as wL+ rK. wL + rK = (w + rK/L)L = (w + rS/L)L. Since w and r are equalized in the world market, there are two elements that determine long run national income. Population or labor force (L) and the savings rate (S/L). Per capita income is (w+rS/L). |
|
| GDP per capita | Lichtenstein ($138,000) → Zimbabwe ($340) in 2014 |
